これも今すぐどうこうという話ではないのだが、Core Plot という iOS/MacOS のグラフ・チャートライブラリを見つけたのでメモ。
公式リポジトリはこちら。
arm Mac で使いたければ、release-2.4 のブランチを使う。
git clone -b release-2.4 git@github.com:core-plot/core-plot core-plot24で落として、framework フォルダ内の .xocdeproj を Xcode で起動。
シェルスクリプトに不具合があるようだが、所定のファイルはできているようなので、この状態で本体自体をビルド。
CorePlot.framework が生成されるので、これを使いたいプロジェクトに取り込んで使用する。
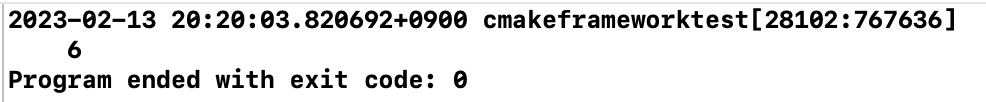
この記事のサンプルを MacOS でビルド。

できてますね。
ソースコードは若干修正して以下のようになる。
#import <Cocoa/Cocoa.h>
#import <CorePlot/CorePlot.h>

@interface ViewController : NSViewController<CPTPieChartDataSource,CPTPieChartDelegate>

@property (readwrite, nonatomic) NSMutableArray *pieChartData;

@end
と
#import "ViewController.h"

@implementation ViewController

@synthesize pieChartData;

- (void)viewDidLoad
{
    [super viewDidLoad];

    // ホスティングビューを生成します。
    CPTGraphHostingView *hostingView = [[CPTGraphHostingView alloc]
                                        initWithFrame:CGRectMake(0, 0, 320, 320)];

    // グラフを生成します。
    CPTXYGraph *graph = [[CPTXYGraph alloc] initWithFrame:hostingView.bounds];
    hostingView.hostedGraph = graph;

    // 今回は円グラフなので、グラフの軸は使用しません。
    graph.axisSet = nil;

    // 円グラフのインスタンスを生成します。
    CPTPieChart *pieChart = [[CPTPieChart alloc] init];

    // 円グラフの半径を設定します。
    pieChart.pieRadius = 80.0;

    // データソースを設定します。
    pieChart.dataSource = self;

    // デリゲートを設定します。
    pieChart.delegate = self;

    // グラフに円グラフを追加します。
    [graph addPlot:pieChart];

    // グラフに表示するデータを生成します。
    self.pieChartData = [NSMutableArray arrayWithObjects:
                         [NSNumber numberWithDouble:40.0],
                         [NSNumber numberWithDouble:30.0],
                         [NSNumber numberWithDouble:20.0],
                         [NSNumber numberWithDouble:10.0],
                         nil];

    // 画面にホスティングビューを追加します。
    [self.view addSubview:hostingView];
}


// グラフに使用するデータの数を返すように実装します。
-(NSUInteger)numberOfRecordsForPlot:(CPTPlot *)plot
{
    return [self.pieChartData count];
}

// グラフに使用するデータの値を返すように実装します。
-(NSNumber *)numberForPlot:(CPTPlot *)plot field:(NSUInteger)fieldEnum recordIndex:(NSUInteger)index
{
    return [self.pieChartData objectAtIndex:index];
}
@end
です。